
With the prevalence of peripheral vascular disease rising, it is critical that vascular specialists maintain a collaborative network of physicians in their geographic regions to enable general practitioners to identify patients with vascular disease, thereby reducing repeated hospitalizations, chronic wound care problems, and amputations.
PADnet® enables a collaborative care model between vascular specialists and primary care, with a diagnostic device that can be operated by a medical assistant. The diagnostic data is uploaded to a secure website so that vascular specialists can interpret the findings, provide a diagnosis, and give care recommendations.
Here are the four reasons to arm general practitioners with this assessment tool.
Reason 1: The clinical burden of peripheral vascular disease
Although the clinical burden of peripheral artery disease (PAD) has become more well-known in the general medical community lately, enabling earlier diagnosis, many still overlook the impact and magnitude of venous reflux disease, leading to under-diagnosis and delayed care. Oftentimes perceived as a cosmetic issue that causes unsightly varicose veins, venous reflux disease can progress to cause non-healing wounds and ulcers.
A study of Medicare data found that chronic, nonhealing wounds and complications affected 15 percent of all Medicare beneficiaries.1 Studies have also found that more than 80 percent of leg ulcers and nonhealing wounds are related to venous reflux disease.2
Venous ulcers have a negative impact on quality of life, causing a loss of an estimated two million workdays per year. In addition, patients with venous ulcers are forced into early retirement, as is the case in roughly 12.5 percent of workers with venous ulcers.3
Similarly, deep vein thrombosis (DVT), affects approximately one million Americans each year. A common complication associated with DVT, Pulmonary Embolism, contributes to at least 100,000 deaths annually.4 Furthermore, long-standing venous reflux disease can lead to the development of other complications and associated diseases such as lymphedema.
Reason 2: Peripheral vascular disease is a huge cost burden on the health system
Even conservative research on the cost of treatment for leg ulcers ranges from $28.1 to $31.7 billion annually.5 Oftentimes, venous reflux disease is not diagnosed until advanced complications such as non-healing venous stasis ulcers develop.
A key component to delayed diagnoses is that venous reflux is often left undiagnosed until a patient is referred to a vein center or vascular specialist, where a duplex ultrasound or vein mapping study is performed. The challenge is that duplex ultrasound and vein mapping procedures are expensive and highly technical in nature and are not readily accessible to the primary care community.
PADnet enables the front-line diagnosis of venous reflux disease through venous refill studies, a non-invasive test that takes approximately seven minutes to be performed, typically by a medical assistant, and be billed as an office visit. On the arterial side, PAD costs the US $319 billion annually to treat and manage—more than diabetes, coronary artery disease, and cancer.6
In 2015, the average annual cost to treat a Medicare beneficiary was $11,173, but for those with PAD, the average annual cost was $72,159.7 Like many chronic conditions, early detection of peripheral vascular disease affords providers the widest range of treatment options, enabling the disease to be addressed with interventions that are lower-cost, less risky, and deliver better results for optimized patient outcomes.
Reason 3: The ABI alone isn’t sufficient to detect PAD
The ABI is a great way to help screen for PAD but it doesn’t offer a complete picture of the patient’s blood flow in their lower extremities, and can sometimes produce false negatives, thereby under-reporting the presence of PAD.
PAD is the result of atherosclerosis in the legs, feet or toes, which occurs when plaque builds up in the arterial walls. When this plaque builds up, arterial walls can harden, especially with diabetic patients. Considering that the process of getting a systolic blood pressure involves completely occluding the artery, it can be almost impossible to get a blood pressure for some patients.
In addition, elevated blood pressures in the arms can mask the presence of disease in the legs, as demonstrated in the case study below.
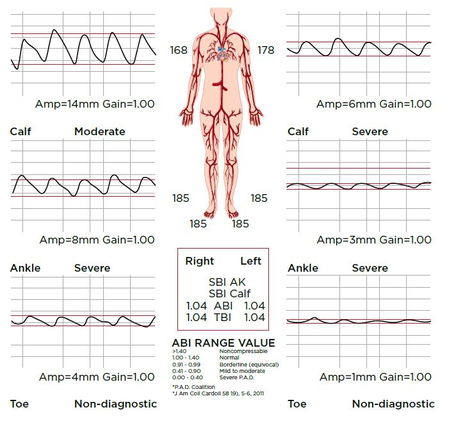
Case Study: Patient has a “normal” ABI, but evidence of disease unmasked with pulse volume recordings
In a physician’s office, a full arterial study was performed with PADnet on a patient. The patient was a 74-year-old female, with a history of increased cholesterol and cancer. Her blood pressures were very high, perhaps due to renal disease. As the results indicate, the ABI is in the normal range, because the blood pressures in the arms and the ankles are identical.
The ABI is simply an index ratio of blood pressures, but upon further analysis of the test, disease is indicated through the dampened amplitudes of the PVRs, especially on the left side of the patient.
Reason 4: PADnet features clinically equivalent diagnostic technology used in vascular labs
PADnet records ABIs as well as segmental pulse volume recording (PVR) waveforms. PVR waveforms alone produce an 85 percent diagnostic accuracy rate for PAD when compared with angiography. Combining the PVR waveforms with a calculation of the ankle/brachial index (ABI) increases the diagnostic accuracy to above 95 percent compared to angiography.8
To confirm that PADnet’s diagnostic data is as accurate as the diagnostic data used by technology typically used in vascular labs, a study was performed to analyze the variance in ABI and PVR amplitude of PADnet versus Doppler technology and the Parks Flo-Lab, technology considered to be the “gold standard” diagnostic technology in vascular laboratories.
Methods
Subjects: Forty subjects agreed to participate in the study.
Testing and calculation: In each of the forty subjects at least one right and one left ankle systolic pressure was obtained using each technology. At least one brachial systolic pressure was obtained in each subject. For each technology used, the highest systolic ankle pressure was divided by the highest systolic brachial pressure to calculate an ABI.
Additionally, in 25 subjects, PVR waveforms were obtained using the two different devices. The PVR waveforms were compared based upon amplitude and morphology.
Results: Of the 40 subjects tested, four subjects were eliminated from comparing the ABI measures because of pressure readings above 200 mm Hg and therefore, the ABI could not be reliably calculated. Two of these four subjects were included, however, in the waveform analysis.
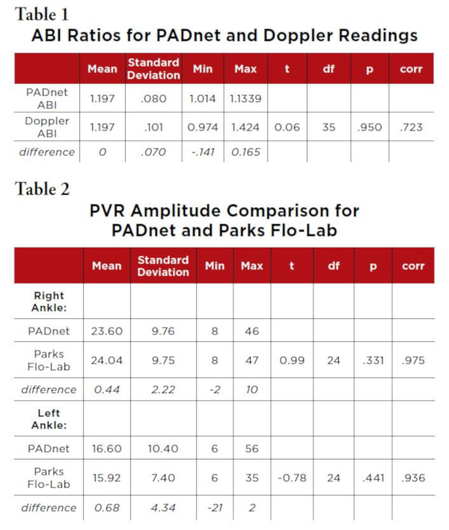
Ankle Brachial Index (ABI): ABIs for the 36 subjects were compared between PADnet derived readings and the Doppler ultrasound derived readings. There was no difference in the mean of the ABI ratios obtained from each method. Both averaged 1.197 to three decimal places. ABIs ranged from .974 to 1.424 in the Doppler readings, and 1.014 to 1.339 in the PADnet readings. The paired-sample t-test comparing the means was not significant: t35 = 0.06, p=.950. The correlation between the two ABI readings was .723. (Table 1)
 The ankle pressure readings and the brachial pressure readings of the PADnet method with the Doppler method were also compared. The ankle readings averaged 3.89 mm lower for the PADnet (t35 = 3.41, p < .001). The
brachial readings averaged 3.53 mm lower for the PADnet (t35 = 3.10, p< .001). The correlation between the ankle readings was r = .900, and for the brachial, r= .887.
These differences did not impact the ABI calculations for the two approaches which were the same (1.197).
PVR Waveforms: In a subset of 25 of the subjects, PVR waveforms were obtained from PADnet and the Parks Flo-Lab system. Waveforms were obtained from both ankles with each device. The waveforms were compared for morphology and amplitude.
There were no differences in the morphology of the waveforms between the two methods. Additionally, there were no significant differences in amplitude between the devices, for either the right or left ankles (t24 = 0.99, ns and t24 = 0.78, ns respectively). The correlations between the two techniques were r = .98 for the right ankle and r = .94 for the left ankle.
In all cases, the amplitude readings were within two units of each other, with two exceptions on different subjects: 1) the Parks Flo-Lab right ankle reading was 10 mm of amplitude higher than the PADnet reading (37 v. 27) whereas the left ankle measurements of 29 and 30 were recorded. 2) the PADnet left ankle was 21 units higher than the Parks Flow reading (56 v. 35) and the right ankle measurements of 38 and 37 were recorded.
Discussion: Among the tested subjects, the PADnet diagnostic technology produced ABIs and PVR waveforms that were clinically equivalent to those produced by Doppler and the Parks Flo-Lab. There were no significant differences in the ABIs of the PADnet and Doppler techniques, nor in the
morphology and amplitudes of the PVR waveforms produced by the PADnet and Parks Flo-Lab.
Conclusion: PADnet is integral to accurately identifying patients with peripheral vascular disease earlier and improving patient outcomes. PADnet technology is easy to use in a primary care setting and supports quick screening protocols as well as reimbursed diagnostic protocols for patients presenting with symptoms of peripheral vascular disease. The research cited in this publication further establishes its usefulness in addressing this major health issue.
Vascular specialists committed to treating peripheral vascular disease should consider building a collaborative care network of PADnet systems with primary care practices to identify these underdiagnosed diseases.
References
1. An Economic Evaluation of the Impact, Cost, and Medicare Policy Implications of Chronic Nonhealing Wounds Nussbaum, Samuel R. et al. Value in Health, Volume 21, Issue 1,27 - 32
2. Simon DA, Dix FP, McCollum CN. Management of venous leg ulcers. BMJ:: British Medical Journal. 2004;328(7452):1358-1362.
3. Everhardt, Robert T., and Raffetto, Joseph D. Chronic Venous Insufficiency. Circulation, 2014; 130:333-346
4. Venous Thromboembolism. Retrieved from: https://www.cdc.gov/ncbddd/dvt/data.html
5. Anand, Sonia S. MD, Ph.D., Caron, Francois MD, et al. Major Adverse Limb Events and Mortality in Patients With Peripheral Artery Disease: The COMPASS Trial. Journal of the American College of Cardiology Volume 71, Issue 20, 22 May 2018, Pages 2306-2315
6. Yost ML. Real cost of PAD 2011 THE SAGE GROUP, Mahoney EM. Circ Cardiovasc Qual Outcomes 2008;1:38-45, American Cancer Society website and ADA Diabetes Care 2013;36(4):1033-46
7. Jaff MR. Ann Vasc Surg 2010;24:577-87, CMS.gov. CMS releases 2015 national health expenditures and Yost ML. Real cost of PAD 2011. THE SAGE GROUP
8. Norgren L, Hiatt WR, Dormandy JA, et al. Inter-Society Consensus for the Management of Peripheral Arterial Disease (TASC-II). Journal of Vascular Surgery. 2007;45(Supp S): S29A